


It was a Sunday afternoon, and I was sitting at my computer, staring at my inbox and grinning ecstatically. I guess sometimes getting an email on the weekend is a good thing after all. I’d just received Avinash Kaushik’s latest newsletter and he was getting deep into digital analytics framework. Why was I so happy? Because he’d written about the same thing I’ve been trying to do with my travel web analytics for the last couple of months. You’d probably feel good too, if the “guru” of web analytics confirmed you were on the right path.
When I do conversion optimization, a deep dive into data is always the first step. That’s why I wanted to create a framework for travel web analytics, something that you could use as a base for your conversion optimization.
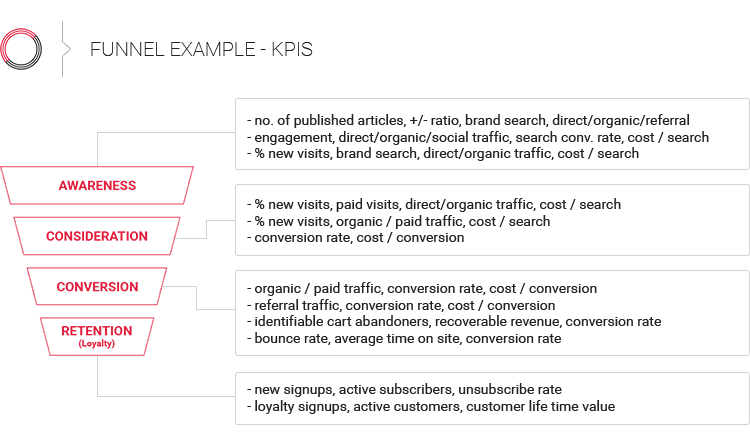
The challenge was to combine both a strategic view and the tactical KPIs needed for your booking funnel optimization. You’ve probably seen many strategic frameworks that made sense but failed to be implemented in practice. Or you’ve read high-level analytics reports but failed to get any actionable insights out of them for your optimization activities.
On the other hand, I’ve seen many marketers work with very tactical reports and KPIs (for example, click-through rates or bounce rates for keywords, funnel pages, etc.) but fail to see and understand the big picture. Sometimes the pitfall of conversion optimization is that you optimize tactical KPIs but don’t get the overall win. For example, you might increase your upsell uptake (e.g., airline bags ala-carte purchase) but decrease overall conversion and revenue.
That’s why I really like Avinash’s digital analytics framework because he broke it down step-by-step, from super strategic to super tactical metrics.
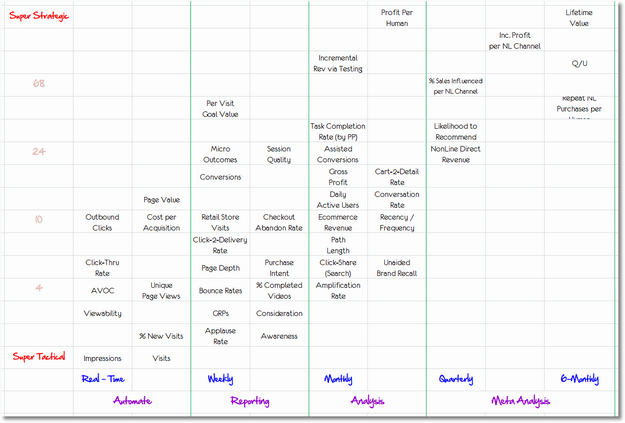
Source: Avinash Kaushik
Of course, I want to show you how to do this for your travel web analytics metrics. Specifically, I want to demonstrate how you can use this concept to increase your conversion optimization.
Skeptical? I’ll show you a real case, using real data and real tools.
You can also see an AirAsia case study of a smart airline digital marketing with detailed analytics and measurement framework.
If you want to identify conversion trends with advanced analytics, your typical web analytics platform is not enough. I use Google Analytics extensively and it’s a great tool. I wrote an extensive post about how to set up your Google Analytics reports for proper measuring of your travel booking funnel. Remember, you need to set up your web analytics tracking properly before doing any advanced analysis.
However, I want you to take another step with your analytics, because when it comes to advanced web analytics there are some things you just can’t do in Google Analytics. For example, you can’t do the following (or at least, it’s difficult and requires workarounds):
An agile BI can enable you to do all the things listed above. I used Qlik for the examples in this article, but Tableau is great as well. Both provide various options and connectors to extract your web analytics data. Another alternative is Google Data Studio, as lately Google has made impressive advances in reporting and data visualization to narrow the gap.
So, let’s see how you can take your analytics game one notch further. First, we’ll start with strategic metrics and reports important for conversion optimization. Then we’ll move down to tactical ones.
Before you get too practical, you need to understand the big picture. You need to be able to identify key trends and understand their impact on your total conversion and bookings. Remember, never do optimization of micro metrics without knowing how they add up.
I’m a very pragmatic person and a big fan of the Pareto 80-20 Principle. It can be applied to any form of optimization, hence I think it’s easily applicable to your website conversion optimization as well.
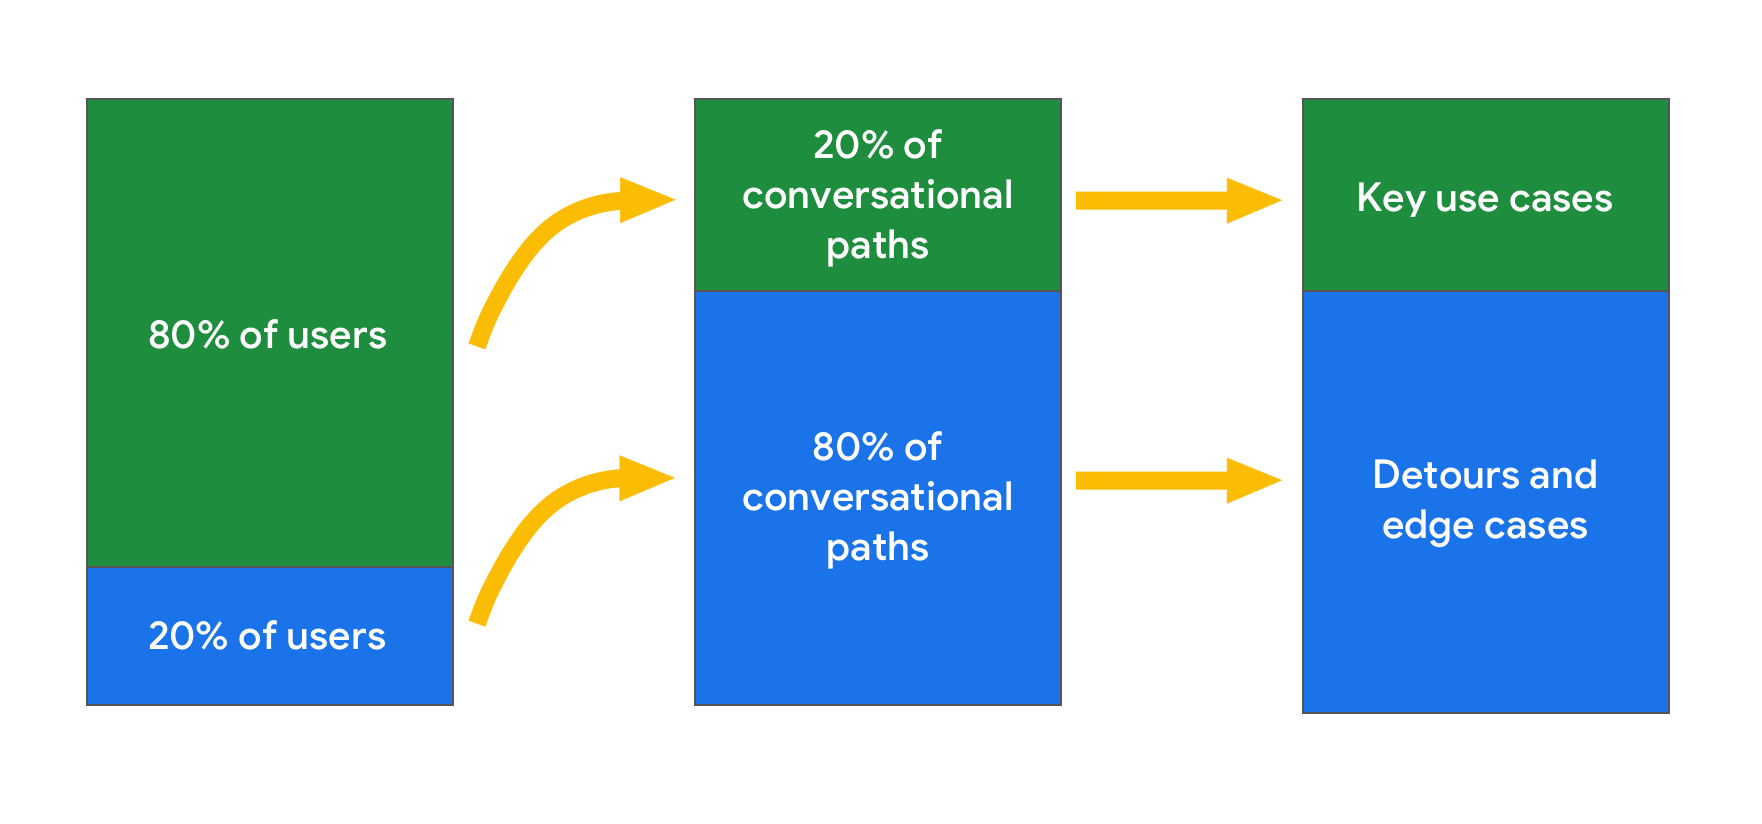
Incorporating the 80-20 approach in your key high-level reports is key to identifying trends that have the highest impact on your conversion rate. That’s why we’ll use visualization methods that will allow you to see the “80” scenarios (like top countries, top traffic sources, etc.) and group the rest (the “20” cases) together.
To identify high-level trends you can use the basic dimensions and metrics. As we dig deeper, we’ll add other metrics and segments.
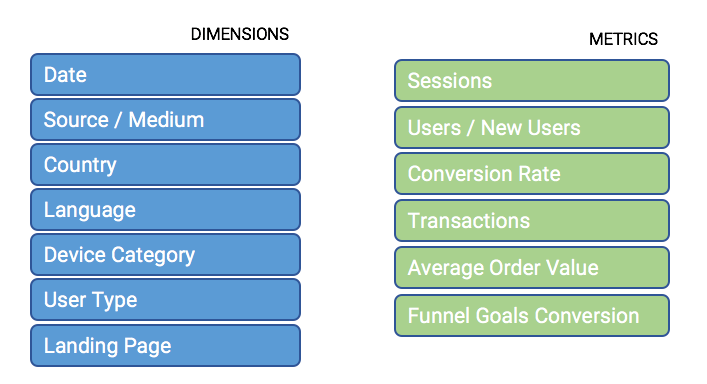
For a high-level overview, you need to see trends for your key metrics. Typical reports for the high-level overview will show you session, user, and conversion trends over time. The key to identifying conversion patterns and potential gaps is that you need to be able to look at them from different angles (dimensions) in a seamless way.
Next step – we’ll identify the search conversion trends (search conversion, search structure) and the product performance.
Once you identify trends in your macro KPIs (like conversion rate drop for a UK market in the January/February period, for our example scenario), you need to go deeper and analyze the micro metrics. Micro metrics will help you understand what happened and the cause-effect on your macro metrics.
In our example, we already identified the first insight by analyzing booking funnel performance (we know that conversion dropped after the search results step).
Below are some other reports and micro KPIs that you can use for your travel web analytics:
For our example scenario, we’ll dig deeper into search performance reports and product performance reports.
In our example, we identified different search patterns for the analyzed customer segment and period. During the analyzed period, our visitors searched for far more in advance than they usually do.
We wanted to validate this and see if the search patterns also reflect in actual booking data. Additionally, we’ll introduce another segment (first-time bookers vs. returning customers) to see if we can identify different patterns across segments.
Segmentation is crucial to really understand user behavior and get actionable insights for your conversion optimization.
Booking lead time report confirmed our search patterns. Not only the analyzed customer segment search for more in advance, also their booking patterns reflect that. Furthermore, we found out that pattern is even more evident for our new customer segment.
Going back to our initial finding (lower conversion rate for this segment and period) we can see there is a gap between demand (search) and our product. But before you form final conclusions and provide actionable insights, there is one more step to do.
Remember the Example 2 video where I found different search patterns for our selected period (January-February 2018) compared to all other periods?
While I was finalizing the videos for this article, my colleague and data wizard Boštjan quickly created a better visualization.
He saw my video where I was switching back and forth to show different trends and created this chart – in a matter of minutes.
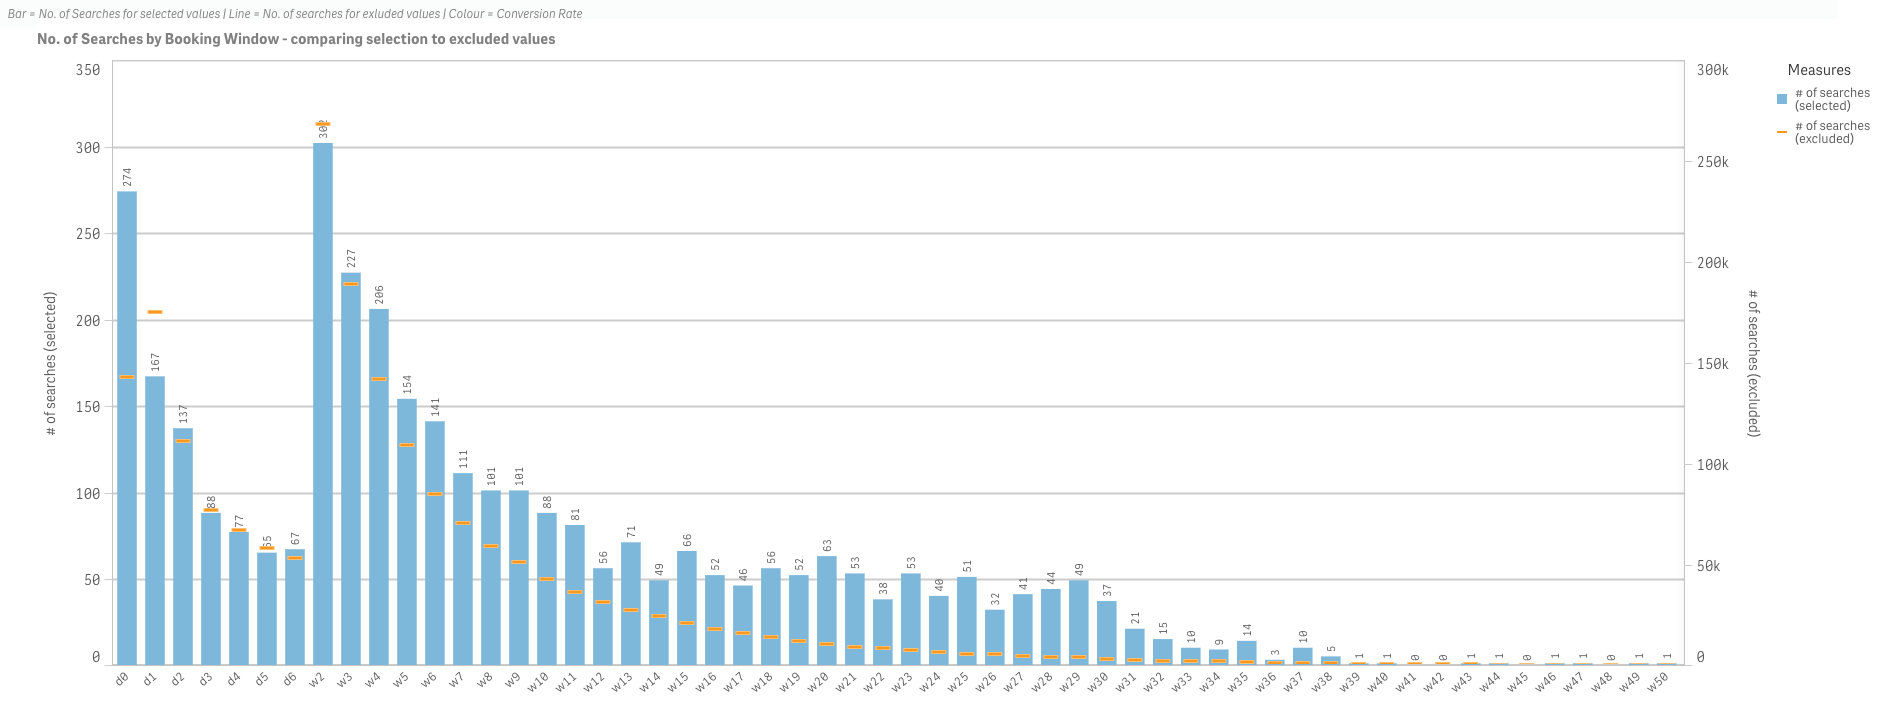
Much easier to see the difference in search patterns for our examined period (blue bars) and other periods (yellow lines), right? This is a great example of agile analytics – fast, flexible and enabling you to find new insights. Or as Boštjan would say:
Experimentiation (with visualization) is crucial part of the process.
So far in our examples, we’ve analyzed web data: session/users and conversion trends, search data and booking data.
However, your website data should not be analyzed in a vacuum as it is just one part of a bigger picture. For more complex analysis, you should be able to add other data sources to your analytics platform. Some examples:
Understanding the correlation between different events and metrics is crucial for forming proper insights. Open source tools like R Studio enable us to perform advanced analytics which were previously the domain of data scientists only. If you want to explore more on this subject, read this great case of analyzing time between bookings and events with R + Google Analytics.
The last part of every analytical exercise is to provide actionable insights. This is why we do this in the first place. Especially in conversion optimization, analytics (followed by user research) is the first step in building a hypothesis for optimization and testing.
For our example scenario, we could use any of these:
For our example, I analyzed historic (past) data. However, an agile travel web analytics platform should allow you to do that in real-time. Your analytics and conversion optimization should be just that – proactive instead of reactive. Once you master this, you can think about the next step: predicting future trends.
Like what you’ve seen? Tired of long analytics projects that span several months but don’t deliver results?
You can do all this with your data in a matter of just a few weeks, sometimes even a few days, without any major investment.
Let’s analyze your web data and jump-start your conversion optimization – LET’S TALK.
If you’re still not convinced, check our data services to learn more >> DIGGINTRAVEL DATA SERVICES.

24Bus India
Great post! I am actually getting ready to across this information, is very helpful my friend. Also great blog here with all of the valuable information you have. Keep up the good work you are doing here. Well, got good knowledge.