


Be agile and data-driven. You’ve probably heard this a lot lately if you’re a travel marketing professional. However, instead of becoming more agile, we are growing busier and more overwhelmed.
Why are we so busy?
Because we’re constantly collecting and analyzing unprecedented amounts of data and struggling to find actionable travel insights. Data generated from bookings, passenger name records, pricing data, customer feedback surveys, website behavior and social networks is growing exponentially. And yes, it can be overwhelming.
In fact, according to IBM’s Global CEO Study, travel and transportation CEOs rank information explosion among the top reasons to transform their organizations. But while we all have been handling large amounts of data for years, we don’t really have the analytical prowess to turn this raw data into real travel insights.
According to another IBM study (Inside the Mind of Generation D):
The travel and transportation industry as a whole generally lags in terms of how data is used.
For example, travel and transportation companies are surprisingly behind in predictive modeling, simulations and next-best-action decision making – which are the three areas necessary to run operations efficiently and target customers effectively.
But while recent studies mainly focus on the use of advanced analytics (which is undoubtedly of high value), I believe that most companies need to step back to (almost) the beginning. You need to evaluate how and which data is used to create actionable travel insights, understand customer behavior and track KPI performance.
Business Intelligence (BI) might sound like old news, but for the majority of travel companies, this is the area to revisit or redevelop first in order to progress to the next stages of data-driven decisions. BI is also a crucial component of the Measure Phase of your travel website’s Conversion Rate Optimization process.
Business Intelligence (BI) and Advanced Analytics are both parts of the wider Business Analytics framework (see this article for more information about it). Together they have the potential to bring great value and even transform your travel business. However, tackling them at the same time might be daunting and, frankly unwise.
You see, in order to be good at advanced analytics you, first need to be excellent at business intelligence.
And to be excellent nowadays means breaking away from traditional approaches, mentality and technology into the world of agile BI.
For most companies in the travel industry, the first problem lies in bringing together all sorts of disparate silos of traveler information. We need booking information from transaction systems, web and mobile behavior (including searches, visits, abandoned carts), email data, customer service info, etc. – to create a single, consolidated view of the customer.
The traditional approach to this problem is becoming a huge bottleneck and does not meet the needs of the rapidly-changing travel landscape. Data-driven travel companies have already recognized this and are therefore driving the shift to agile and self-service models.
According to recent research by Forbes Insight, analytics and business intelligence in particular are at a crossroads. Frustrated with the long waiting periods, high costs, and questionable quality of reports developed on their behalf, business leaders are concerned about getting left behind.
Your IT teams who are responsible for keeping the business informed have probably spent vast resources defining a methodical, painstakingly detailed BI system development life cycle. This cycle typically goes something like this:
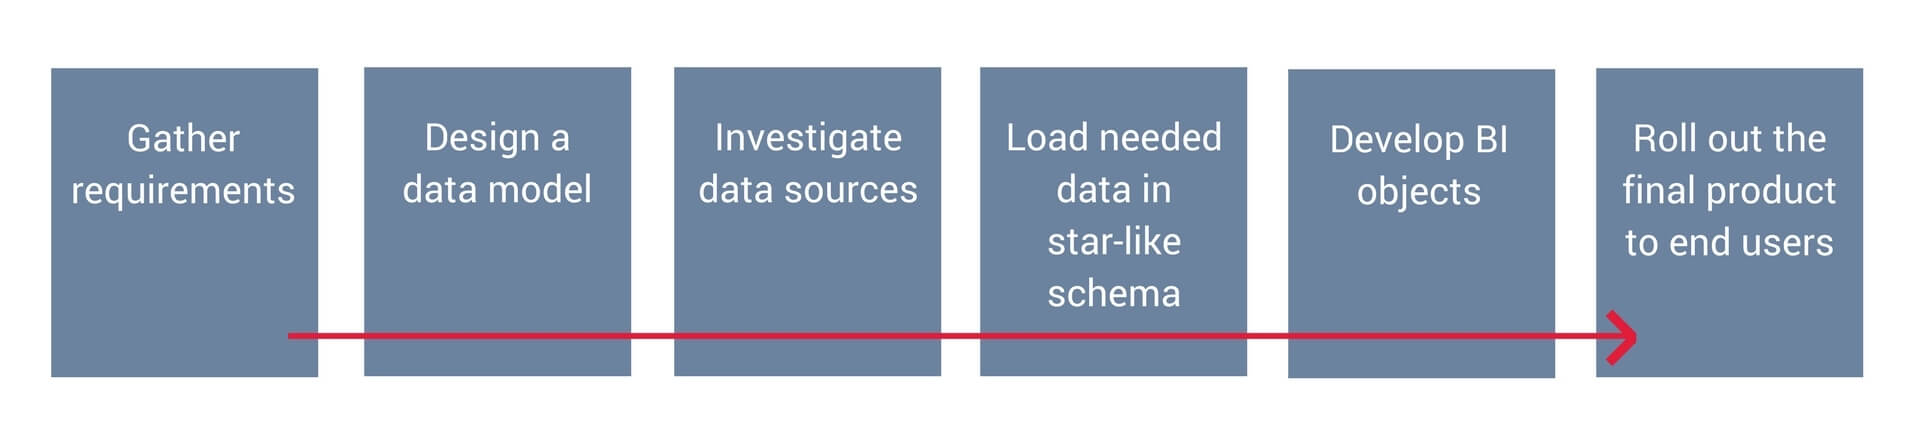
Unfortunately, the quest to achieve perfection often results in anything but ideal results. The problem is perfection is all about context. What was considered ideal back during the requirements process isn’t so great now. Is it the business user’s fault that the context changed? Clearly not, but the fact remains that just as companies need to be agile to succeed, the process by which we deliver BI analytics needs flexibility baked in.
BI agility is achievable. BI perfection is not.
Agile BI is also about giving more power and freedom to the users. According to the abovementioned Forbes Insight research, the most successful BI programs are significantly more likely to place analysis and decision-making solutions into the hands of business users. They have long been in the position of passively receiving information, and you might think they don’t have the right capabilities to be data-driven, but you need to start making the shift.
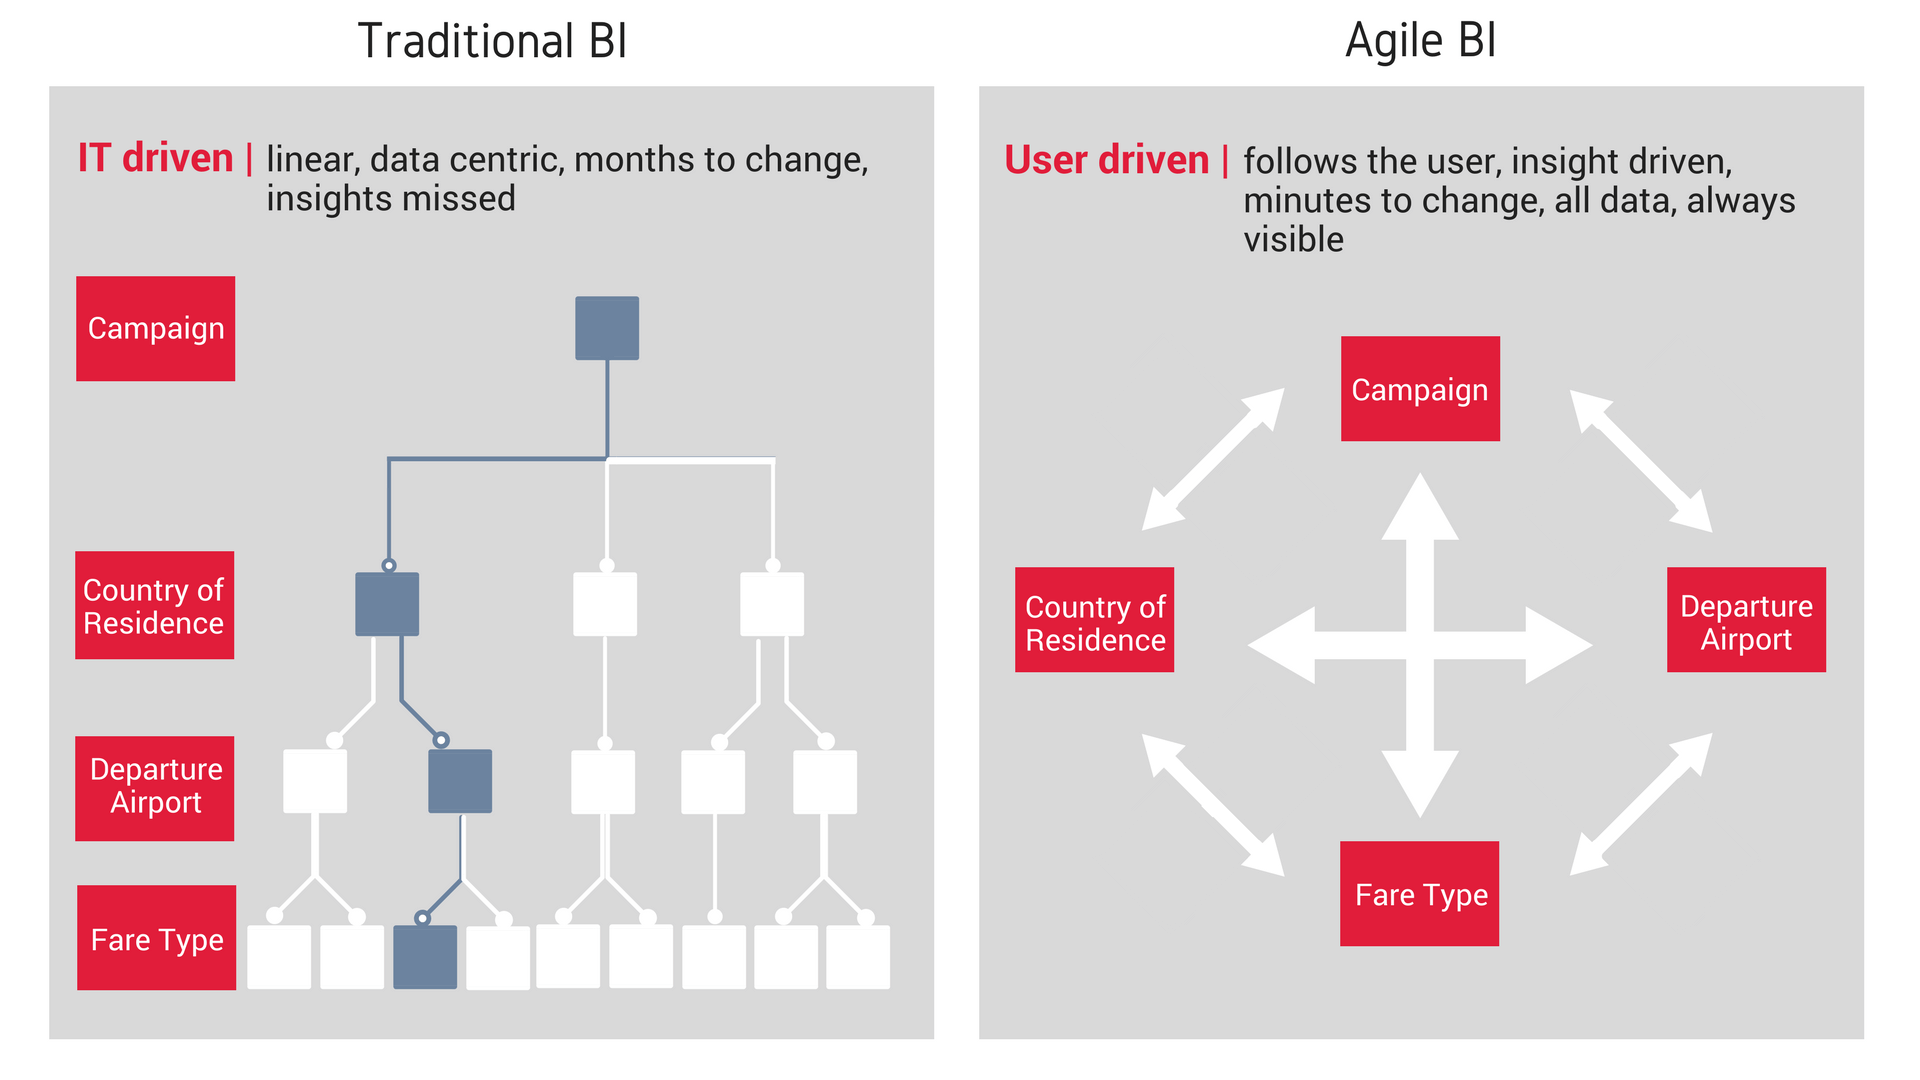
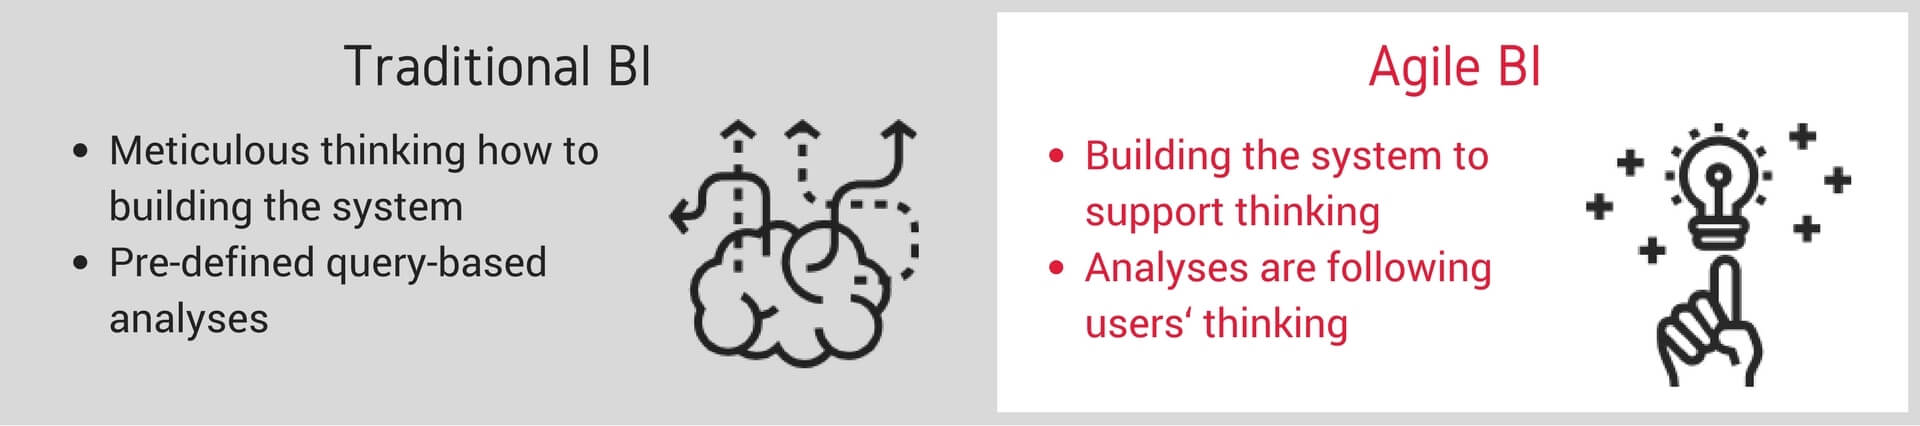
Difference between the traditional BI and agile BI
Agile BI offers a new BI paradigm. Instead of thinking about how to build a BI system (and plan all its moving parts and anticipate users’ requests and organizational needs), build a system that will support thinking – a system that will encourage exploration, self-service, and agility and help you discover insights you can actually act on.
Query-based traditional BI tools separate the application layer from the data. This means long customization cycles required to answer new business questions, but most of all, it kills flexibility.
For example, say you want to analyze the variability of length of stay in your different hotels. You look at regions and then drill down to countries and cities to compare similar hotels. What if you want to do a comparison of hotels based on ratings? Then you have to start a new report/query. Based on location type? Another one. You probably get the point.
However, the biggest problem here is answering the questions no one has thought of before.
Agile, self-service BI, on the other hand, allows you to interconnect data in real-time. You can get answers to your questions as you form them.
“Gathering and mining more and more data will not lead to better decisions. BI that isn’t fundamentally self-service driven is not intelligence at all.” – Frank Kozurek, Head of Business Intelligence at National Express, UK
In today’s competitive travel industry landscape, organizations must be agile, data-driven, and responsive. Constant change and disruption is inevitable. Everything is dynamic and you need to identify patterns that impact your business fast. Travel decision-makers are challenged with coming up with ideas no one else has had yet, just to survive and compete. These requirements put pressure on decision support systems to be highly flexible.
Simply stated, the traditional BI process prohibits ideation. The problem starts when the business user puts in a request to IT. The answers they’re seeking are a starting point for building a “reporting” solution. The data is put into a form to provide reporting in a system where the end user has no ability to ideate. This is where the traditional BI process fails: it starts with a single alternative of analyzing the data and building a solution around that. The end user has no freedom to apply design thinking framework on data analysis with the traditional BI process. And without this “freedom,” it is very difficult to discover actionable travel insights.
Agile BI not only provides a nimble technical environment, but also changes an organization’s approach to data exploration. For example, it fosters testing and prototyping that are critically important in the ideation process. If you are a travel decision-maker, you need a BI system that helps you think, test ideas, and discover actionable insights – and do so quickly. You need tools that are flexible and agile and enable you to ask a business question, build a chart to find the answer, see connections, and then change the chart or create a new one instantaneously.
A good example of a company known for its ideation, data usage and creation of new approaches to business is Southwest Airlines. According to the company spokesman:
“Southwest uses aggregated, anonymous customer data to promote products, services, and featured offers to customers on multiple channels, devices, and websites including Southwest.com. By observing and looking into customer behaviors and actions online, we are better suited to offer our travelers the best rates and experiences possible. We also use this data to support the evolving relationships with our customers.” (source)
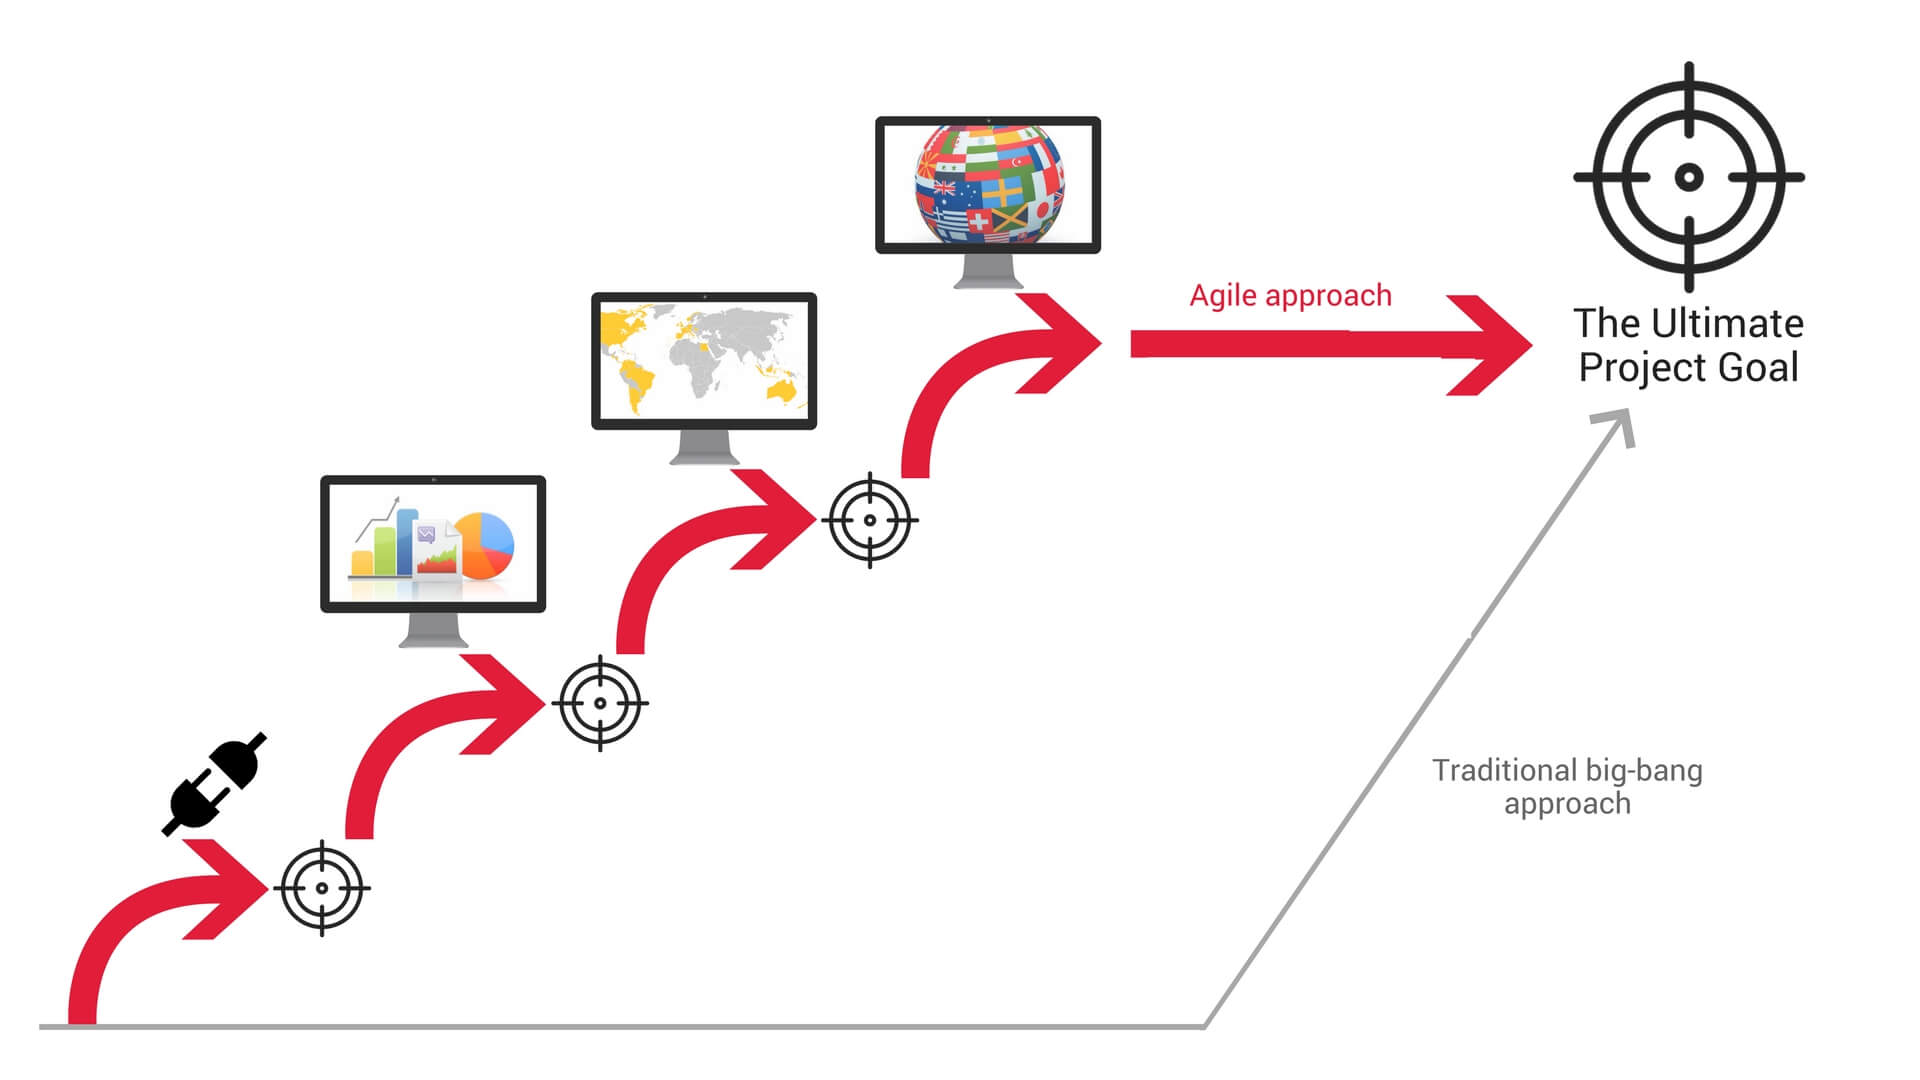
When an organization embraces agile BI, BI projects are broken down into a series of smaller projects that are planned for, developed, tested and rolled out on a continuous basis. This iterative development approach facilitates continuous improvement and helps an organization adapt more quickly to changing market conditions and organizational goals. Each iteration is planned and reviewed by both the development team and the business owners who have requested work. This close collaboration between business and IT results in better communication, clearly-defined goals and end results that more accurately meet expectations.
As with any agile initiative, agile BI tends to reduce total cost of change and promote a culture that values reflection, accepts change and understands how to respond flexibly to shifts in organizational value. Because BI project iterations are released on a regular basis, changes to dashboards or data models can be made functional in a matter of days or weeks, providing travel analysts with the travel insights they need to make data-driven decisions much faster than could be realized with a more traditional big-bang project approach.
Every second, your travelers (customers) are creating a lot of new data – every user interaction, booking, and customer engagement leaves you with data that you can either use or, most often, forget.
The data that is left unanalyzed or not used effectively is called dark data. Gartner describes dark data as “information assets that organizations collect, process and store in the course of their regular business activity, but fail to use for other purposes.”
Not using data effectively can be very costly – for example, bad data supposedly costs United Airlines 1 billion USD annually, or approximately 3% of annual sales.
For travel companies with a strong online presence, dark data represents a sizable portion of all data stored. Such examples might include:
These data points or features are often overlooked by marketing teams as serving any useful purpose. Usually there is a perception that this type of information is only collected for compliance, fraud protection or regulatory requirements.
This is where agile methods of data visualization, exploration and discovery can be used to find new ways of activating dark data to provide new opportunities for your travel organization.
While dark data can appear dusty and uninteresting on the surface, there are methods that will turn it into highly granular, rich customer insights – which reveal whether your customers are traveling for business or leisure, whether they have small children, and whether they’re tech savvy, price sensitive, etc.
Skyscanner, for example, were dealing with an overwhelming volume of data, ranging from web traffic to flight schedules and marketing campaigns – all buried in tens of thousands of Excel spreadsheet rows. Thus, they often overlooked important details. In addition, the inflexible nature of spreadsheets meant that they couldn’t efficiently test hypotheses or react to new market opportunities.
They turned to agile BI to deliver travel insights and share them quickly and easily across the business. Today, multidisciplinary teams from across the business quickly identify trends and analyze web traffic data to help design sales and marketing campaigns, grow revenue, and increase brand loyalty. Answers to questions such as, “Is this traveler planning his next trip, just returning from one, or looking for inspiration on where to go?” are just a few clicks away for them. (source)
Another example of taking a data-driven approach to create personalized ancillary offers is Singapore Airlines. Using data, dynamic merchandising and pricing to create personalized offers should be “the core” of your ancillary revenue framework, if you are an airline looking to increase ancillary revenue.
Thanks to data analytics, Singapore Airlines has been able to drive a 20 per cent greater uptake in sales of preferred seats – which come at a fee – to selected passengers. This can be expanded to other areas of ancillary revenue such as duty free products, insurance and cabin upgrades. (source)
To get the most out of your data, you should work on visualizing it – not because graphics are cute or fun, but because visual presentation can often communicate more efficiently and comprehensively than text alone.
Formally speaking, data visualization is the use of visual representations of abstract data to amplify cognition and communication. Simply put, visualization helps us think and communicate. While it is true that some people have better visual memory than others and some are better at understanding raw numbers, we are all visual creatures and thus we can all “read” visuals more effectively than numbers.
This is because the human visual system is an extremely fast pattern-seeker that provides us two main benefits:
Benefit 1: It is much faster than any other method of perception
Benefit 2: It reveals patterns that would otherwise remain hidden
Conscious reading vs. subconscious visualizing
Let’s consider the following example and try to answer the following question: How many times does the digit ‘5’ appear in the sequence of numbers?

How long did it take you to come up with the answer when you were reading the digits one by one compared to turning on your visual mechanisms? I’m sure you figured out the answer in the second example much faster.
However, we should not ignore the fact that there is a time, place and purpose for utilizing tables as well as graphs:
“Dashboard” is a buzzword often misused to describe any display that is interactive and/or graphical. Ideally, a dashboard is a visual display of the most important information needed to achieve one or more objectives that has been consolidated and arranged on a single screen so it can be monitored at a glance (Stephen Few).
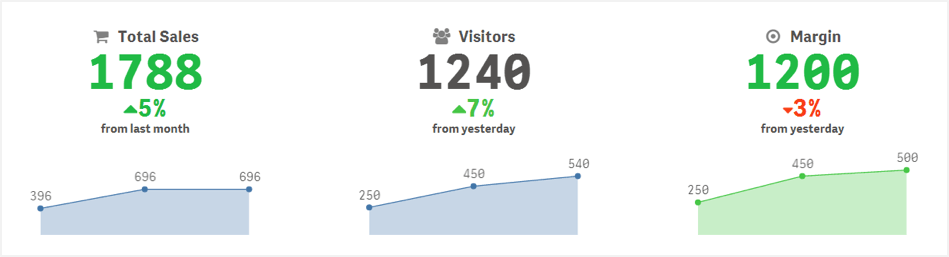
Example of KPI representation showing the numbers in context
Dashboards are tools that improve your “span of control” over a lot of business data. You must design them to help your users maintain so-called situation awareness:
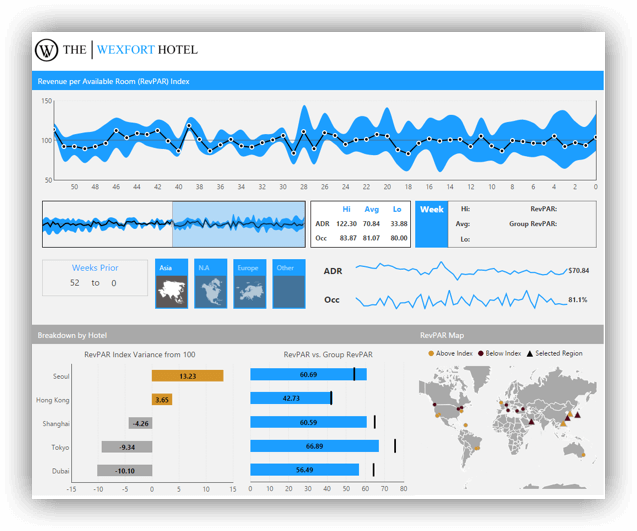
Example of BI dashboard for a hotel
But remember – different users (roles) have different objectives, so they must each have their own versions of dashboards.
The dashboard does its primary job if it tells the viewer in little more than a glance how he should act. To do that, a dashboard should always show numbers in context. Examples of context include:
At Southwest Airlines, the dashboards have replaced monthly PowerPoint reports, which took an analyst two full days each month to prepare. Now, instead of creating a new report every month, the analyst simply refreshes the data to update the dashboard. (source)
The travel industry is changing quickly, and so should you. The days of BI as a huge, big-bang project are over. Today you need to embrace agile methods of both system development as well as data usage. In order to compete with other travel businesses, you must find valuable travel insights faster.
Give your users access to all the data they can possibly have access to, not only the data you think they need. You will be amazed by how quickly users who previously had no new ideas and didn’t know the data well will start getting new insights.
“People now feel the value in themselves because their work makes a greater impact on the company,” says Troy Roskop of Southwest Airlines. “It’s that proud feeling you get from knowing you’ve really made a difference. And you can’t get there until you have the right tool in place.”
Yes, you also will need to change your technical environment to support agile thinking. You can use some of the great tools available in the market today, such as Qlik or Tableau. They are built for agile and will make the whole process of discovering travel insights easier for you.
The experience is out there. Great examples are numerous. Users are ready. Data is bountiful. It’s now down to you to become agile and data-driven.
If you want help – LET’S TALK more about Agile BI and we can help you master your data!
Or learn more about Diggintravel data services to help your grow your travel business here.

No Comments